Recent content by NiSt1205
-
Bannerlord Not Starting With Nvidia CPU
Where did you get an nVidia CPU?!? You, lucky boy!- NiSt1205
- Post #9
- Forum: The Citadel - General Discussion
-
Calradia’s Next Butterlord
Garios' title is 'General'- NiSt1205
- Post #8
- Forum: The Keep - Singleplayer
-
What do you think about population?
Can't remember the name, it was something on the lines of Rise of Kingdoms. I was your second in command in a guild you found, and we managed to stay in the top ten for a while- NiSt1205
- Post #85
- Forum: The Citadel - General Discussion
-
What do you think about population?
Oh, my! Is that really you? We knew in a mobile game a couple of years ago, I lived in the friary at that time. It's good to see you, hope you are ok- NiSt1205
- Post #81
- Forum: The Citadel - General Discussion
-
Mountain fishing village ?
there are aven trees that grow fish

and
Ledro has quite a lake to support fishing
Sure, and there are a lot in the mountains 'round here. Ledro's lake is not even the biggest, maybe is in the top 10 but I'm not sure about that. Your question was about fishing as main source of food, anyway, and it is well documented at least in this area, but I'm quite confident that other areas with mountain lakes have developed a similar economy- NiSt1205
- Post #8
- Forum: The Citadel - General Discussion
-
Mountain fishing village ?
Well, were I come from (northern Italy, just south of Austria) it's quite common. Fisher's villages in the mountains are well documented since the Bronze Age (Ledro, for example, but there are others)- NiSt1205
- Post #5
- Forum: The Citadel - General Discussion
-
Dual wielding combat
I can disprove that chart with one simple concept. The sample size is incredibly small.
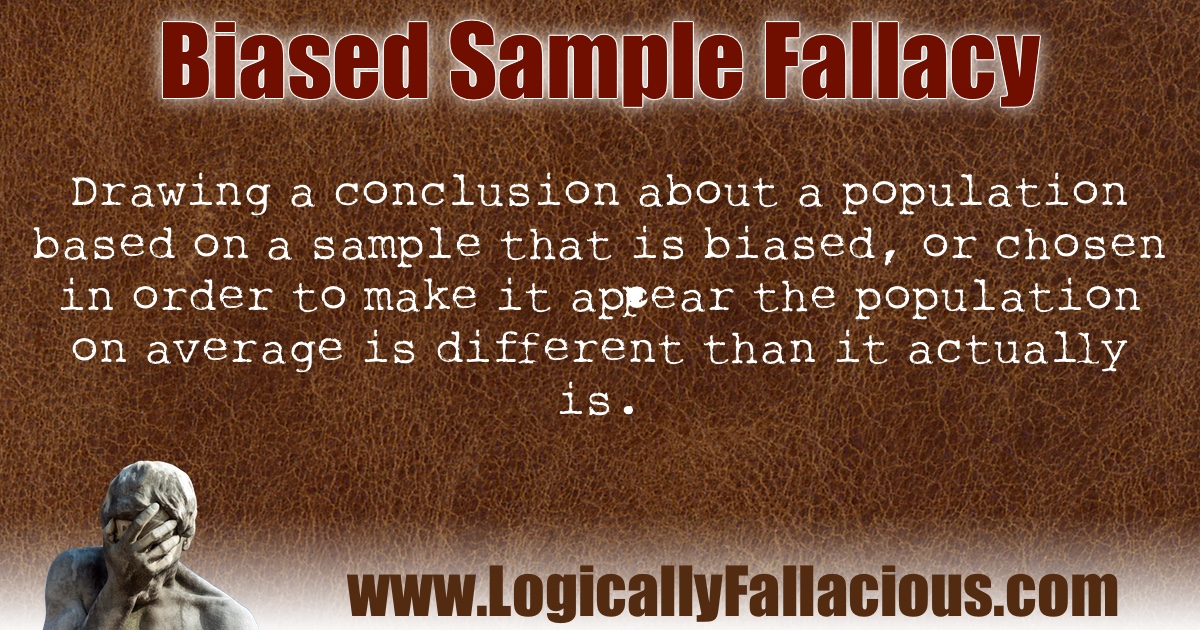
Biased Sample Fallacy
Drawing a conclusion about a population based on a sample that is biased, or chosen in order to make it appear the population on average is different than it actually is.www.logicallyfallacious.com

Problems with small sample sizes
In psychology and neuroscience, the typical sample size is too small. I’ve recently seen several neuroscience papers with n = 3-6 animals. For instance, this article uses n = 3 mice per group in a …garstats.wordpress.com
The chart documents the casualties of ~1500 soldiers. That's not even the results of a medium-sized battle, more like a large skirmish.
You can't base the trends of an era on the results of a skirmish, or even 5/10/20 battles.
You need long-term data for accurate long-term understanding.
There are things that, if they could be understood, there would be non need for you to explain- NiSt1205
- Post #100
- Forum: The Citadel - General Discussion
-
SP - General Why are character traits so bad?
If my memory is good enough, that represented disputes between two AI lords, such as fighting over fief assignment and so on- NiSt1205
- Post #5
- Forum: Suggestions
-
Performance issues on older rigs + Win10
good to know thanks
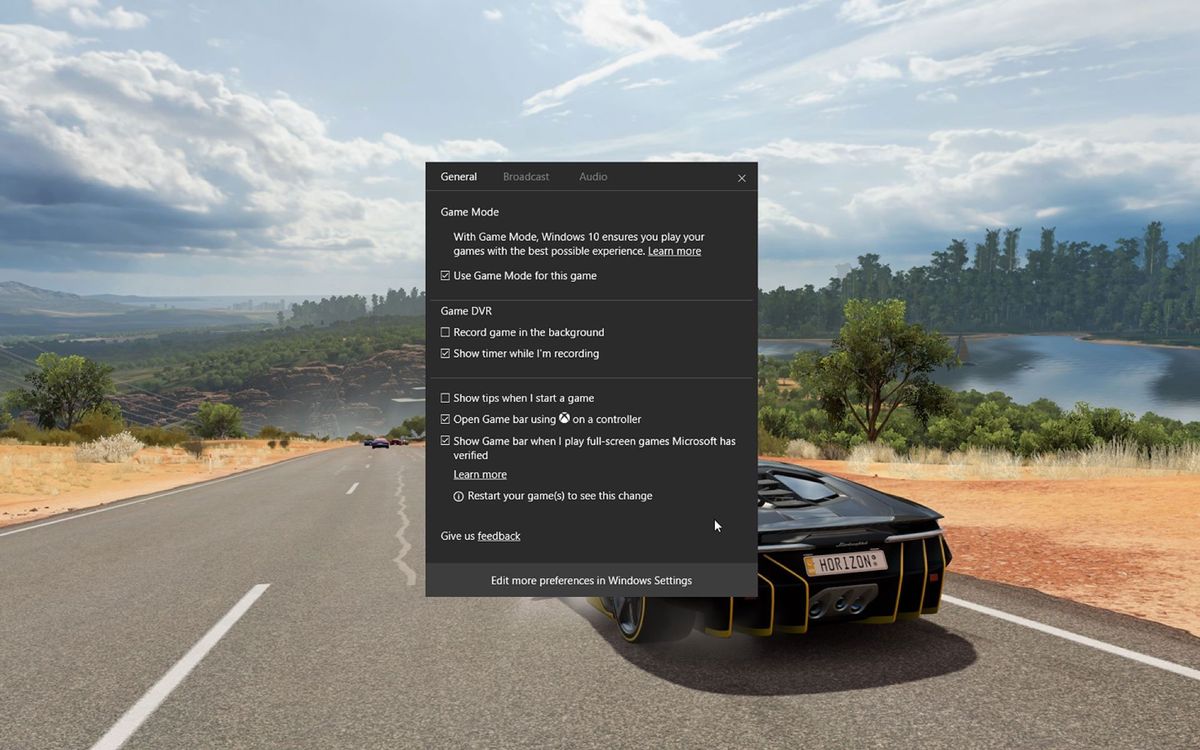
Try turning off Windows 10's Game Mode if your games are stuttering or freezing
A growing number of users say Game Mode is causing performance issues in games. www.pcgamer.com
Yeah, that's the source. I didn't actually read it, though, I had the suggestion from a friend which did- NiSt1205
- Post #8
- Forum: The Citadel - General Discussion
-
Performance issues on older rigs + Win10
1080 p downscaled 15% on min settings, @45-70 fps depending on the situation. Even lower on particularly crowded sieges- NiSt1205
- Post #3
- Forum: The Citadel - General Discussion
-
Performance issues on older rigs + Win10
Hi all, for those having perfomance issues on older configurations and Windows 10 may improve their fps by disabling Windows Game mode (you can find it in settings under xbox icon, then game mode, toggle switch off). This helped me on my laptop with i7 4750 HQ cpu, 16GB RAM, Samsung Evo 850...- NiSt1205
- Thread
- 4th gen cpu low spec
- Replies: 7
- Forum: The Citadel - General Discussion
-
Taleworlds please fix it :(
Yep. It's "Prevent Nobility Escape"
-EDIT- Also, to OP, TW is aware that the end game needs heavy balancing. They already fixed the most damaging issues, but currently end game is lackluster at most, with indepent kingdoms struggling to survive as the most obvious issue. This heavily depends on main quest being incomplete; with you being unable to stop the conspiracy you end up being at war with 3/4 factions at one time. So yeah, you are right, end game is currently frustrating. This is a known issue which developers are very aware of.
If this is a blocking issue for you, I strongly recommend you to try the aforementioned mod, which helps a lot by reducing the number of parties at enemies' disposal, but is balanced out by the fact that requires you to actually track down and defeat enemy leaders.- NiSt1205
- Post #7
- Forum: The Keep - Singleplayer
-
SP - General More things to do
Same apply as per your other post- NiSt1205
- Post #2
- Forum: Suggestions
-
SP - General Arerai teir two need upgrade
Please your spelling is pointless must upgrade and have better than this- NiSt1205
- Post #2
- Forum: Suggestions
-
SP - General Why are character traits so bad?
RtR. The second one was Right to Rule, but it did matter only if you did plan to raise your own kingdom. Or to take over someone else's in VC. Or whatever it did in other exps/mods
-EDIT- Oh, and I completely agree with you. It's an improvement over what Warband's diplomacy was. To OP, also keep in mind that the trait system we currently have is very incomplete. It lacks traits leveling and more, so what you see is just a sketch of what it should become, therefore it may feel poorly designed atm, but it really just needs a couple of tweaks and it should be nice- NiSt1205
- Post #3
- Forum: Suggestions